Heuristic site evaluation
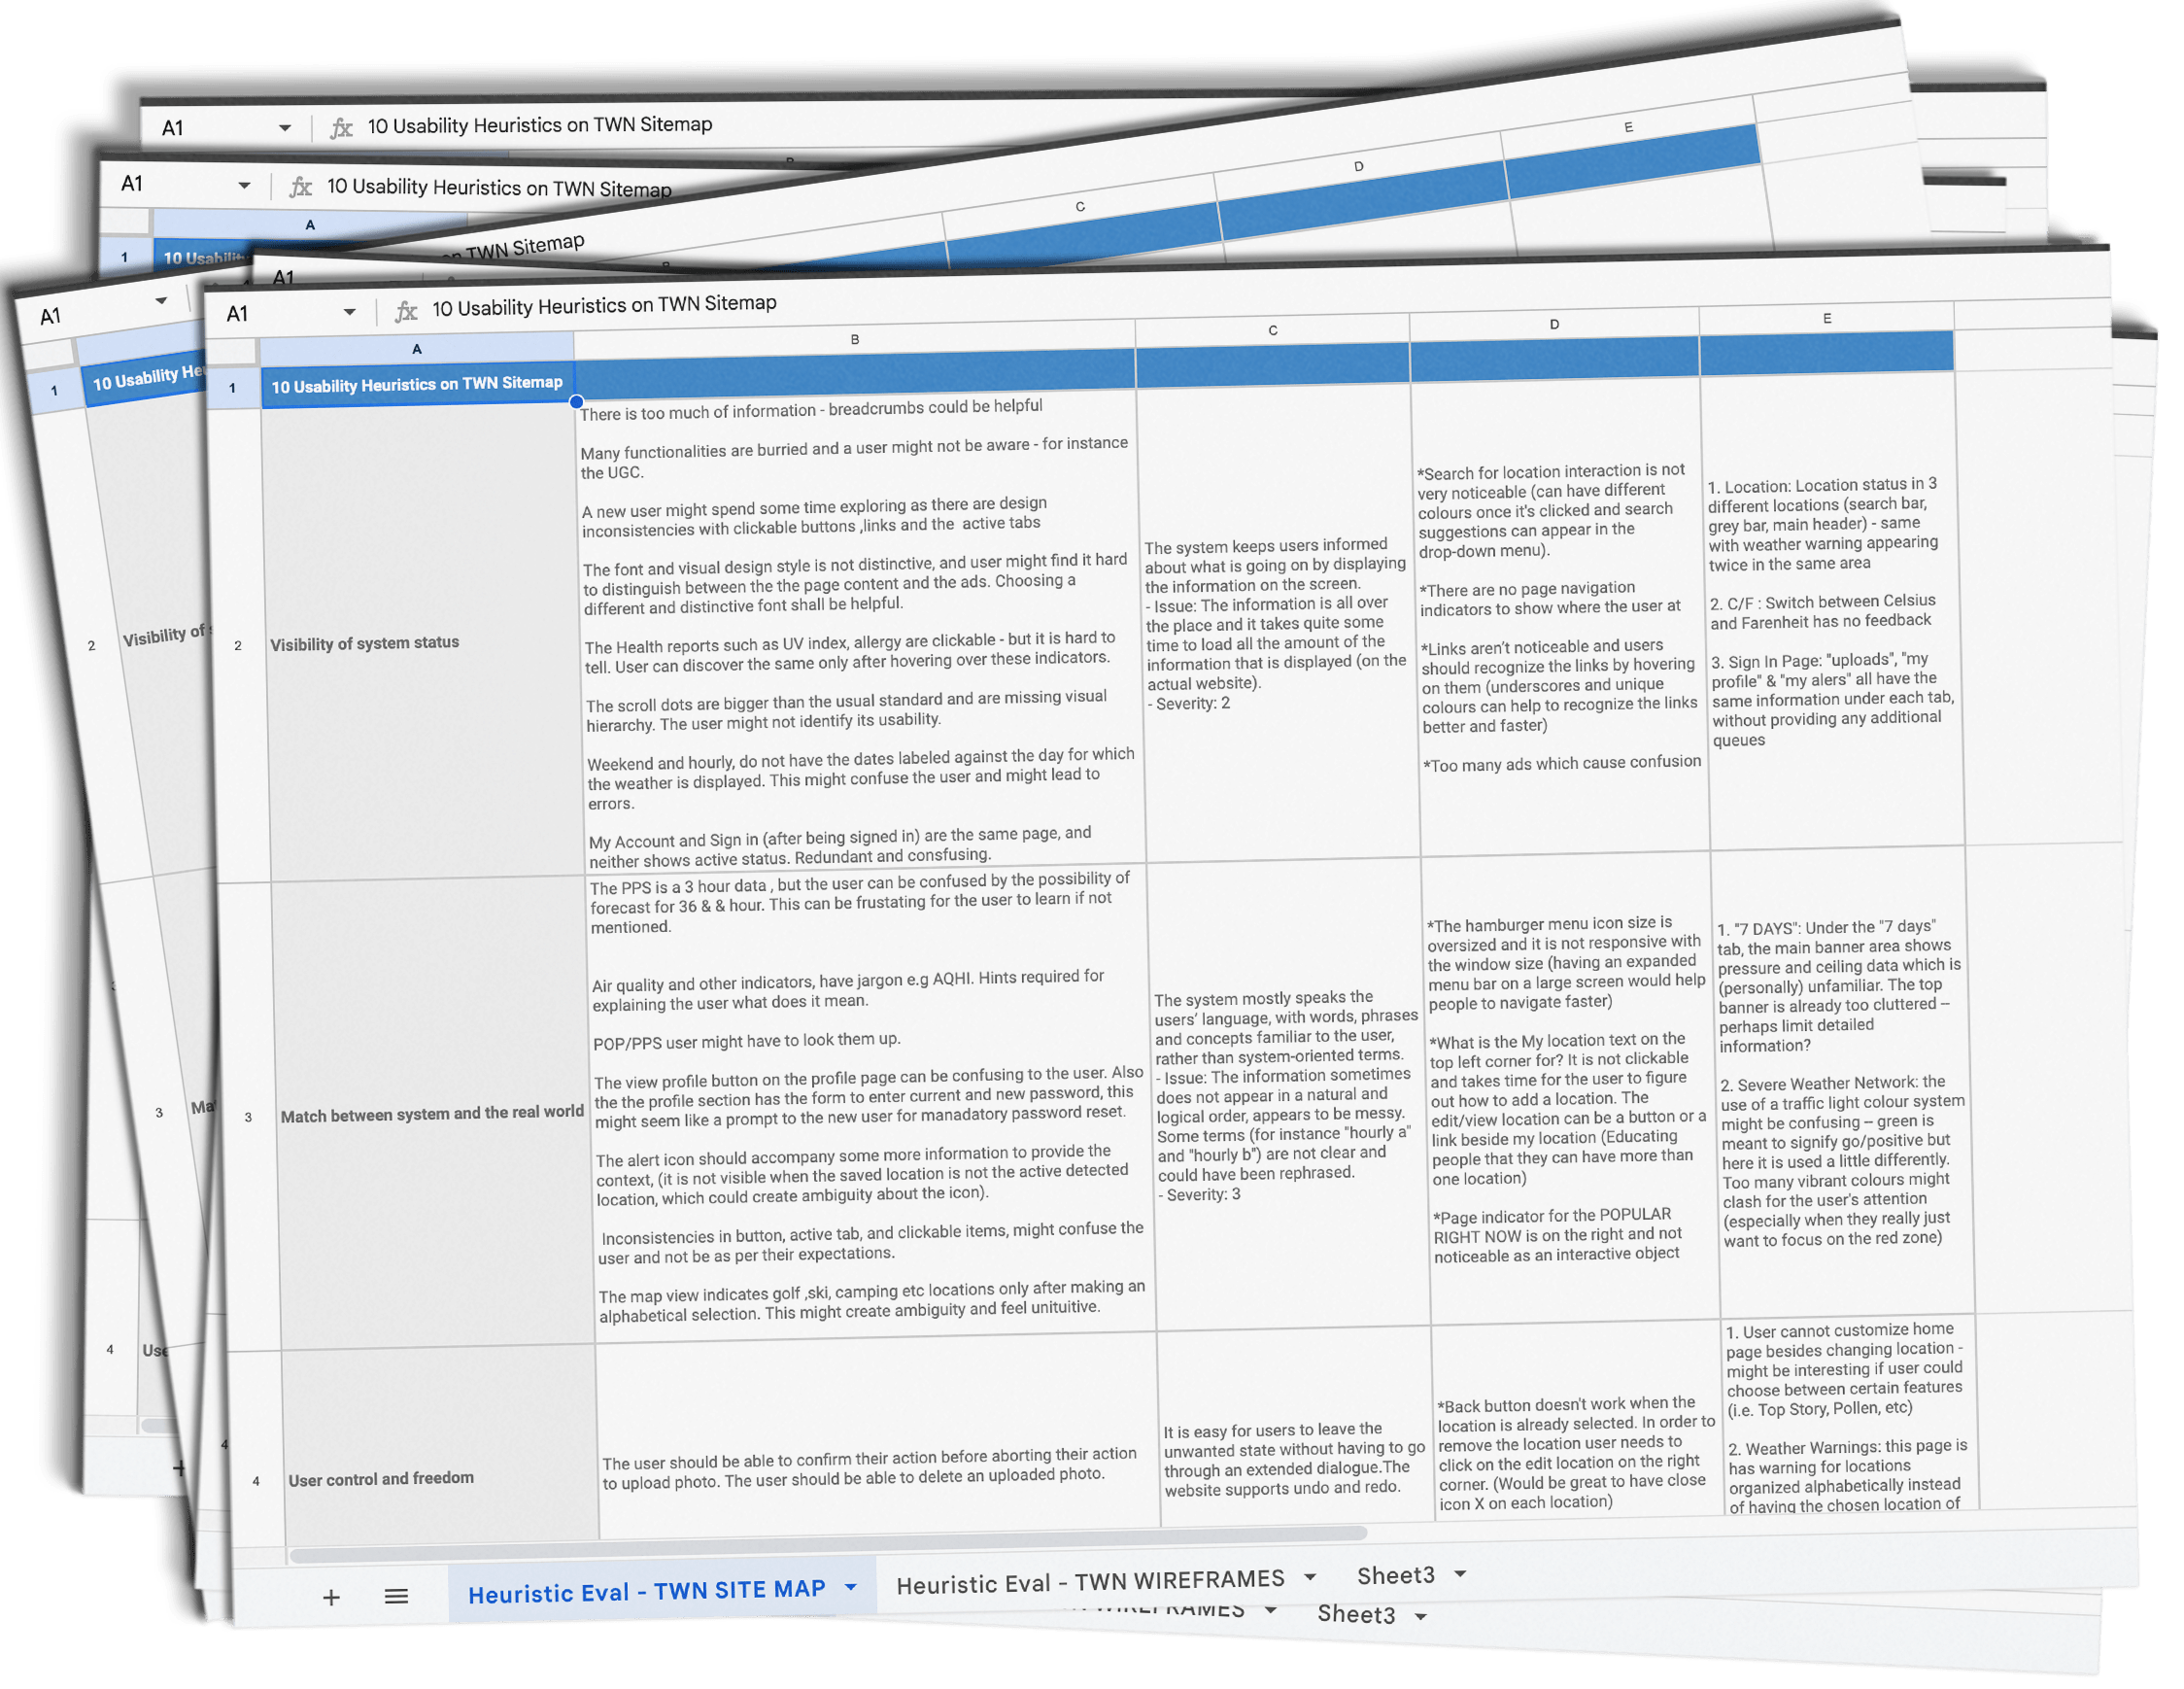
Heuristic The Weather Network’s website evaluation was done to identify issues and therefore provide solutions on how to overcome them. The evaluation was done based on Jakob Nielsen’s Heuristics. Some of the analysis process is shown below.
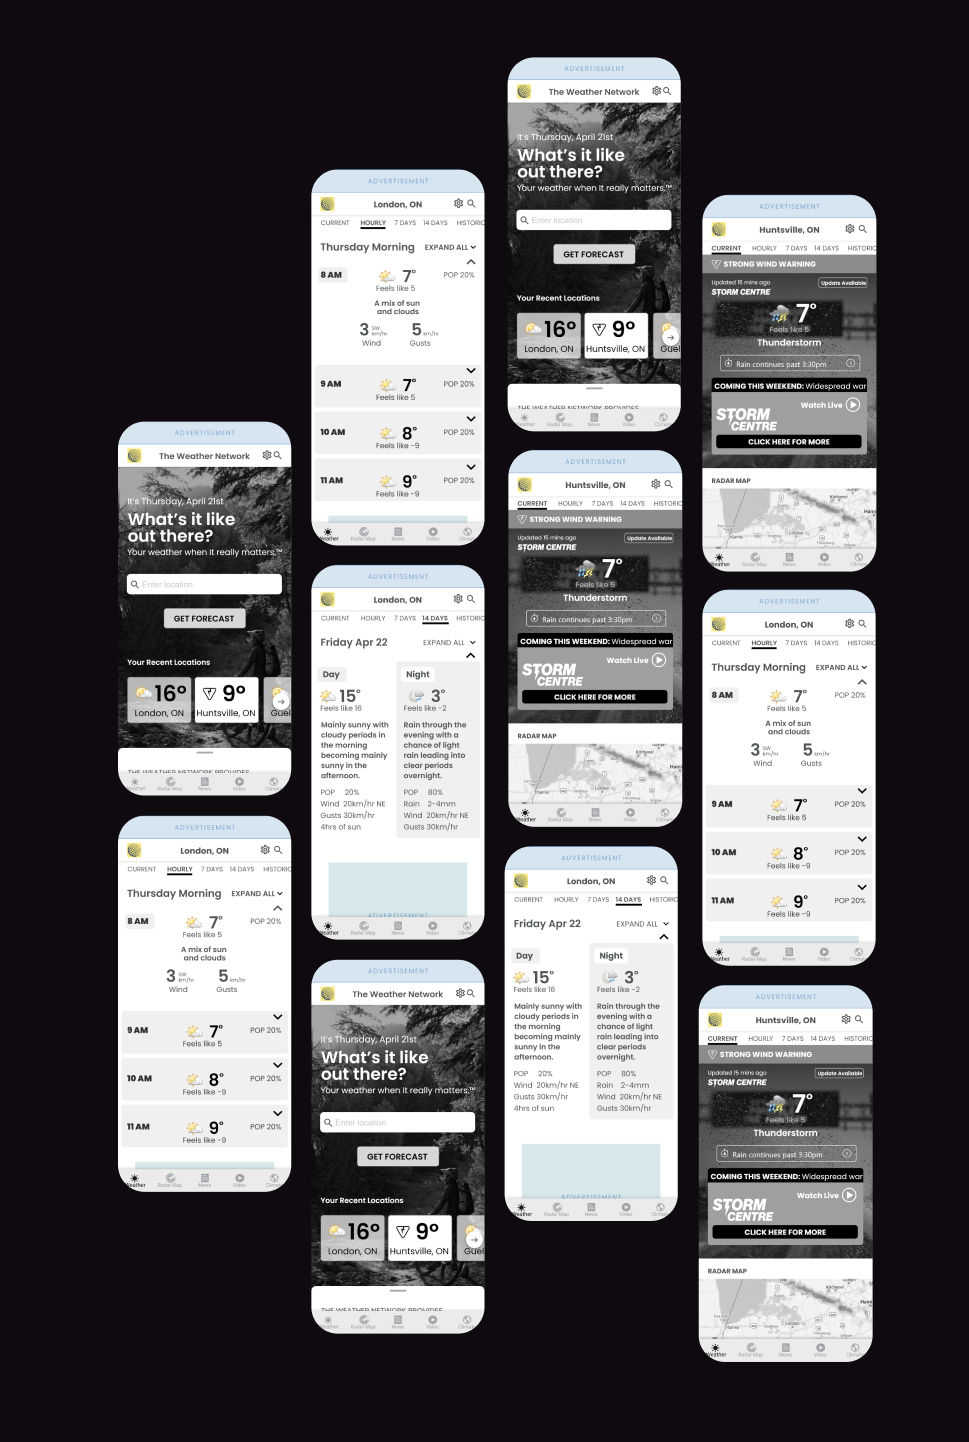
User testing
The first phase was dedicated to heuristic analysis, while the second phase and third phases of the project were dedicated to web usability testing and to mobile usability testing, accordingly. The objective was to collect data regarding the wireframes to make user-informed decisions about the wireframes’ performance and potential improvement.
Qualitative data: comments of the participants and general behavior observations.
Quantitative data: the amount of time a user spends on a task as well as the number of clicks a user makes to complete each task.
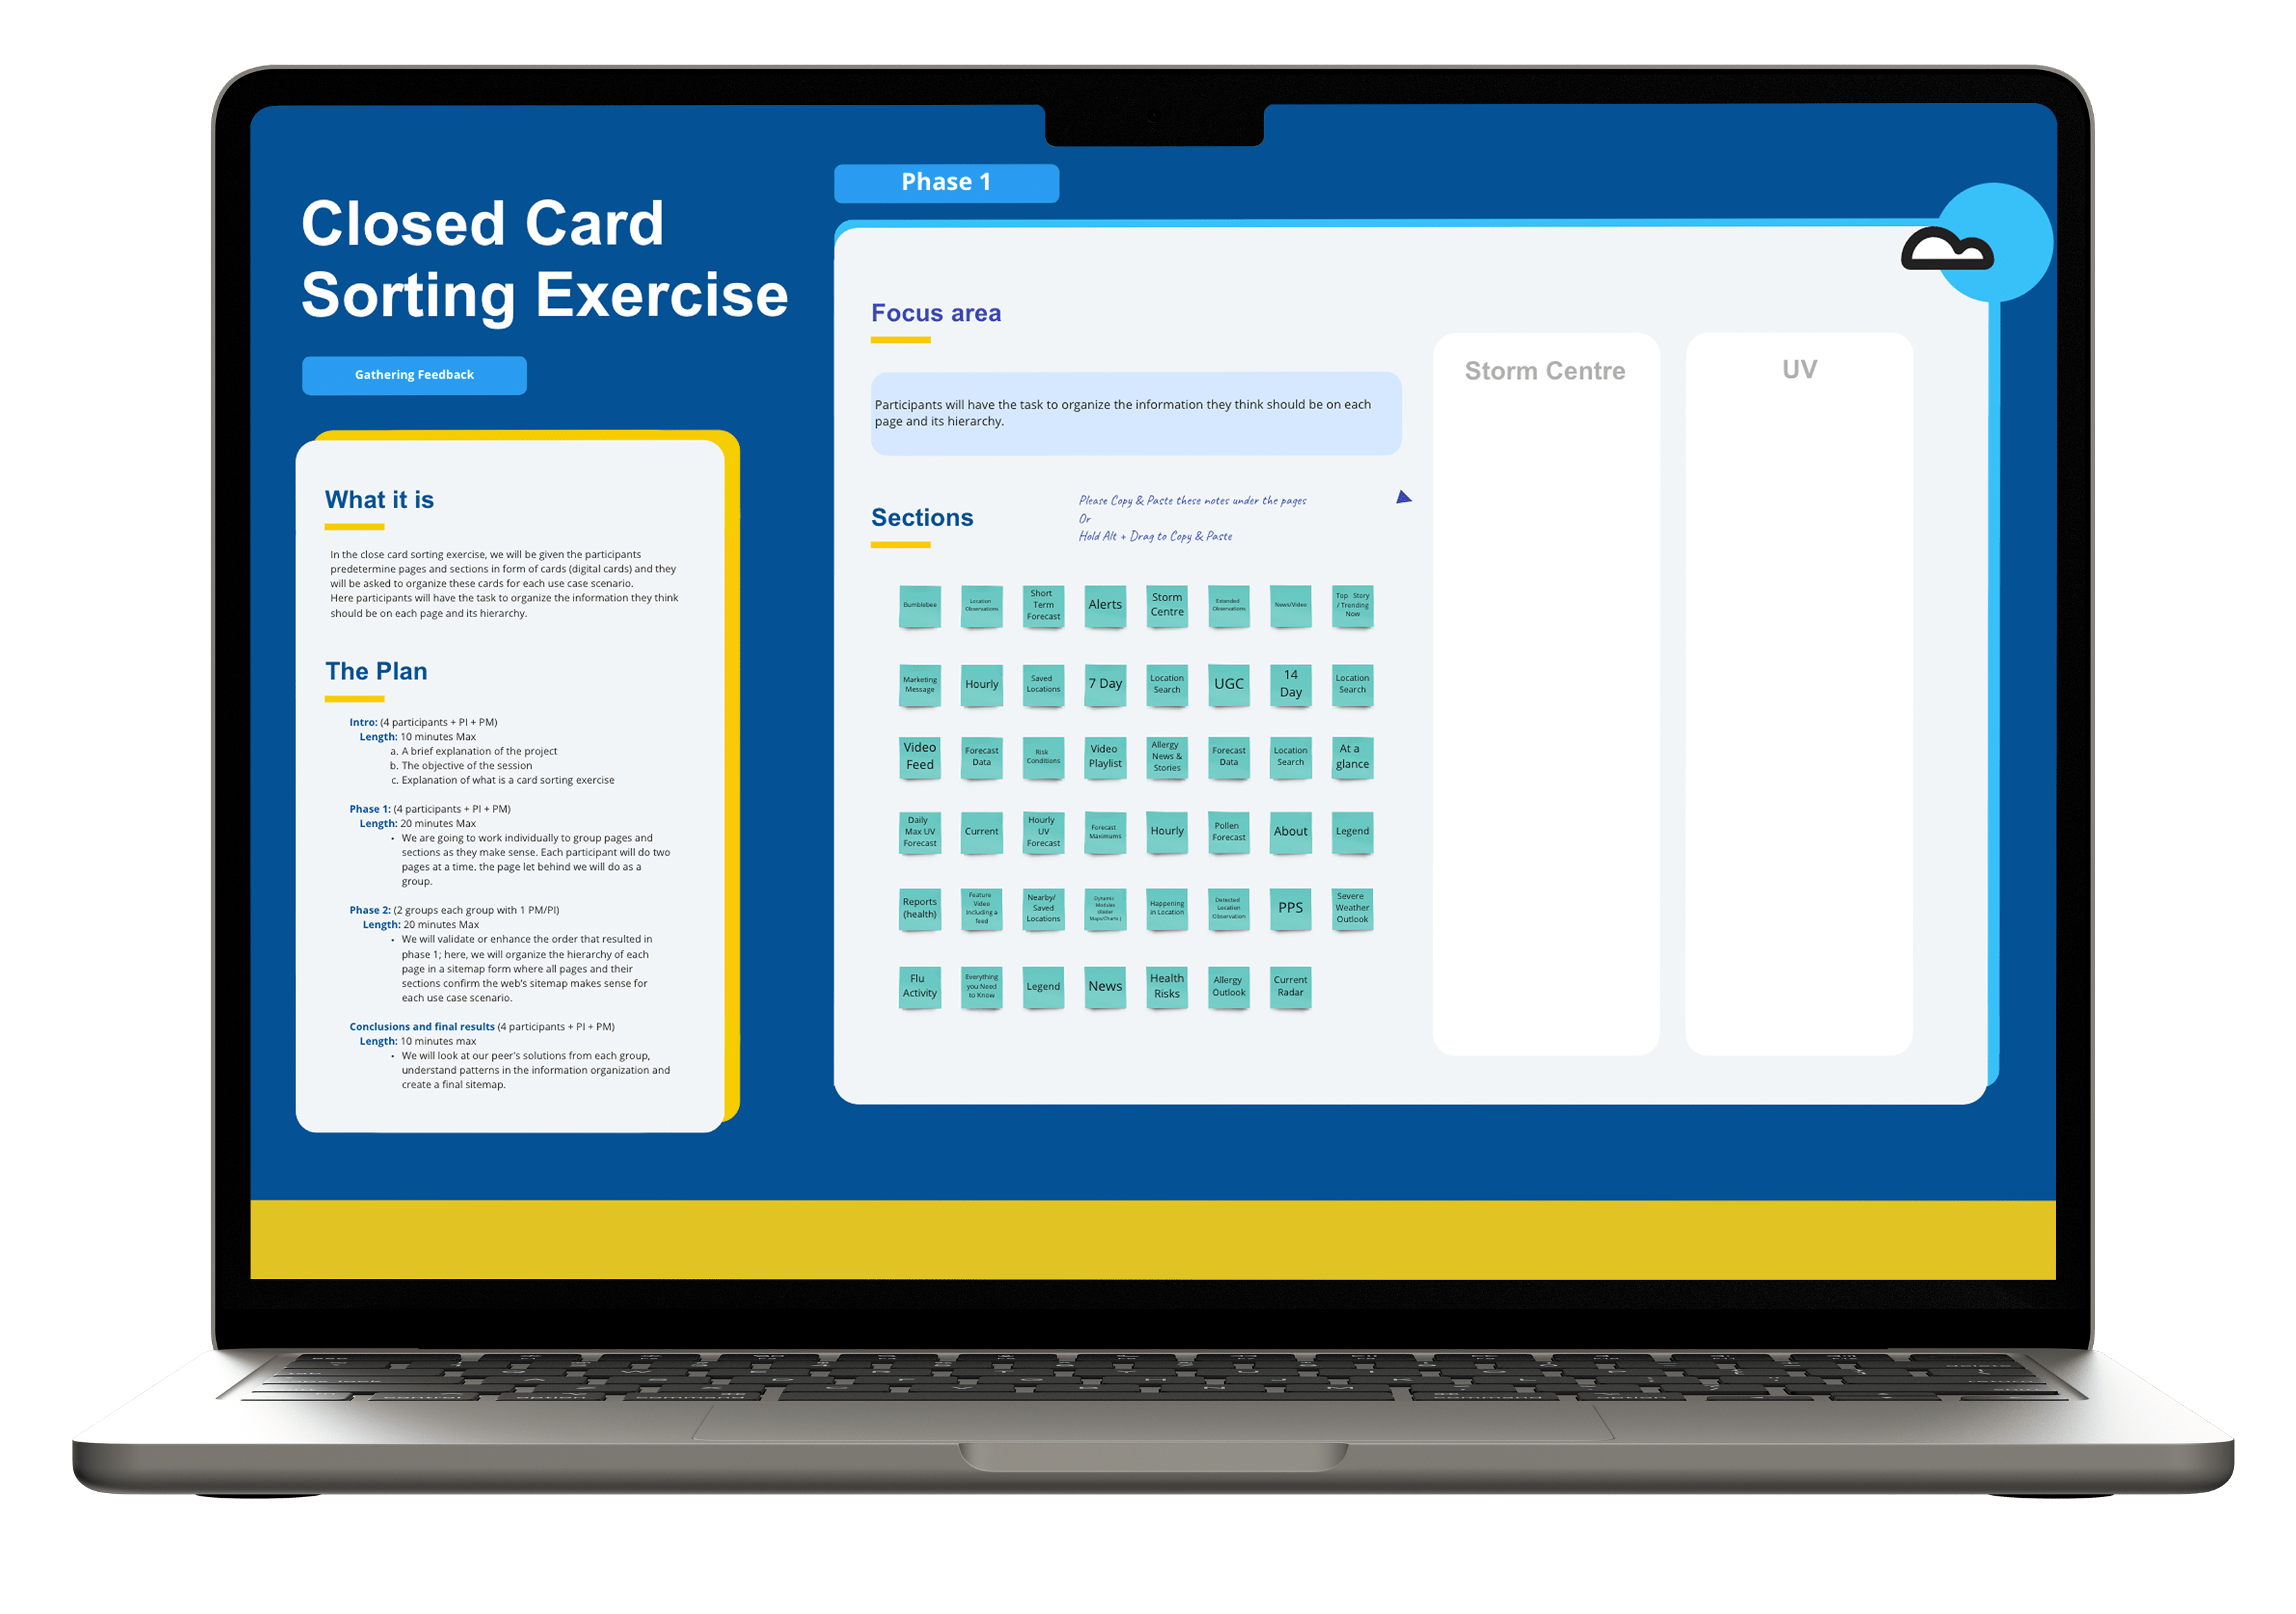
Card sorting exercise
Usability testing is good for detection of local issues, yet for the analysis of the site structure, we decided to hold a card sorting exercise. At first, the heuristic evaluation of the website structure was made by designers and researchers, and then we recruited the participants to carry out a card-sorting exercise to juxtapose our assumptions with what the users think. Below there are shown the boards the participants were using during our exercise.
Results
The received data was organized after each testing session into the report tables. Key points taken after each testing session were synthesized and turned into design improvements. The actual designs cannot be shown because of the Confidentiality and Non-disclosure Agreement.